Travel Booking Data Warehouse
/ 4 min read
Updated:Table of Contents
The Situation
A travel booking platform stores operational data across multiple tables: flights, hotels, customers, airlines, airports. The database works fine for running the business — processing bookings, managing inventory.
But when the analytics team asks simple questions:
- “How many bookings did we get last week?”
- “What’s the average ticket price trend this quarter?”
- “Which routes are most profitable?”
The answers require complex queries joining 5+ tables, with no clear grain for aggregation. Every analyst writes their own version, getting slightly different numbers.
The ask: Build a data warehouse that makes these questions easy to answer.
Understanding the Source
The source database (pactravel) contains:
| Table | Description |
|---|---|
customers | Customer profiles |
airlines | Airline master data |
aircrafts | Aircraft types and capacity |
airports | Airport codes and locations |
hotels | Hotel properties |
flight_bookings | Flight reservation transactions |
hotel_bookings | Hotel reservation transactions |
The core problem: OLTP schema ≠ OLAP schema.
OLTP (Online Transaction Processing) systems optimize for writes — fast inserts, normalized to avoid redundancy. Think booking systems, POS terminals, inventory updates.
OLAP (Online Analytical Processing) systems optimize for reads — fast aggregations, denormalized for fewer joins. Think data warehouses, BI dashboards, reporting.
This project transforms OLTP source data into an OLAP-friendly dimensional model.
Designing the Warehouse
Identifying Business Processes
Before touching any code, I mapped out what the business actually measures:
- Flight bookings — revenue, volume, routes, customer segments
- Hotel bookings — revenue, occupancy patterns, property performance
Each becomes a fact table — the central tables that store measurable events.
Defining the Grain
The grain answers: “What does one row represent?”
| Fact Table | Grain |
|---|---|
fct_flight_bookings | One flight booking (one passenger, one flight) |
fct_hotel_bookings | One hotel stay (one reservation, one property) |
Getting the grain right is critical. Too coarse (daily aggregates) and you lose detail. Too fine (every click) and queries become slow.
Building Dimensions
Dimensions are the “by” in “revenue by airline” or “bookings by month”:
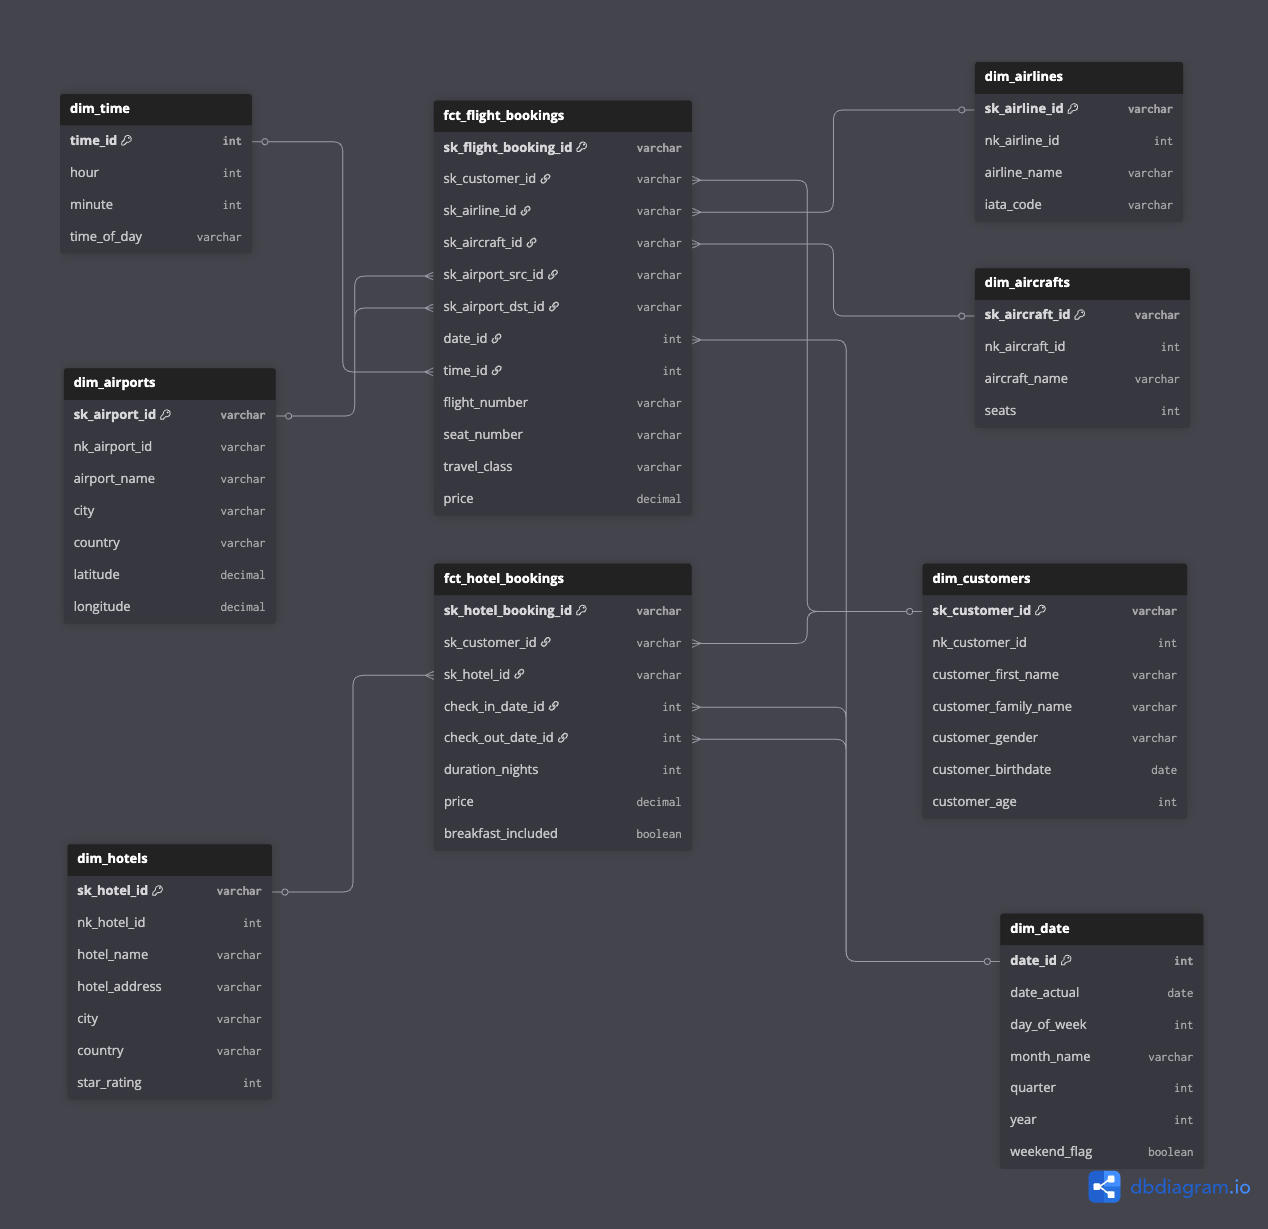
Why separate dim_date and dim_time?
Pre-calculating date attributes (day of week, quarter, fiscal year) once means every query can filter by WHERE weekend_flag = true without computing it on the fly. Same for time-of-day analysis.
SCD Strategy
For this use case, I chose SCD Type 1 (overwrite on change):
- Customer updates their email? Overwrite the old value.
- Airline changes their name? Overwrite.
Type 1 is simpler and sufficient when you don’t need historical tracking of dimension changes. If we needed “what was the customer’s address when they booked?”, Type 2 would be necessary.
Building the Pipeline
The ELT Pattern
I chose ELT (Extract-Load-Transform) over ETL because:
- Leverage the warehouse — PostgreSQL is powerful; let it do the heavy lifting
- Transformations in SQL — Easier to version, test, and debug than Python transformations
- dbt fits perfectly — Purpose-built for the “T” in ELT
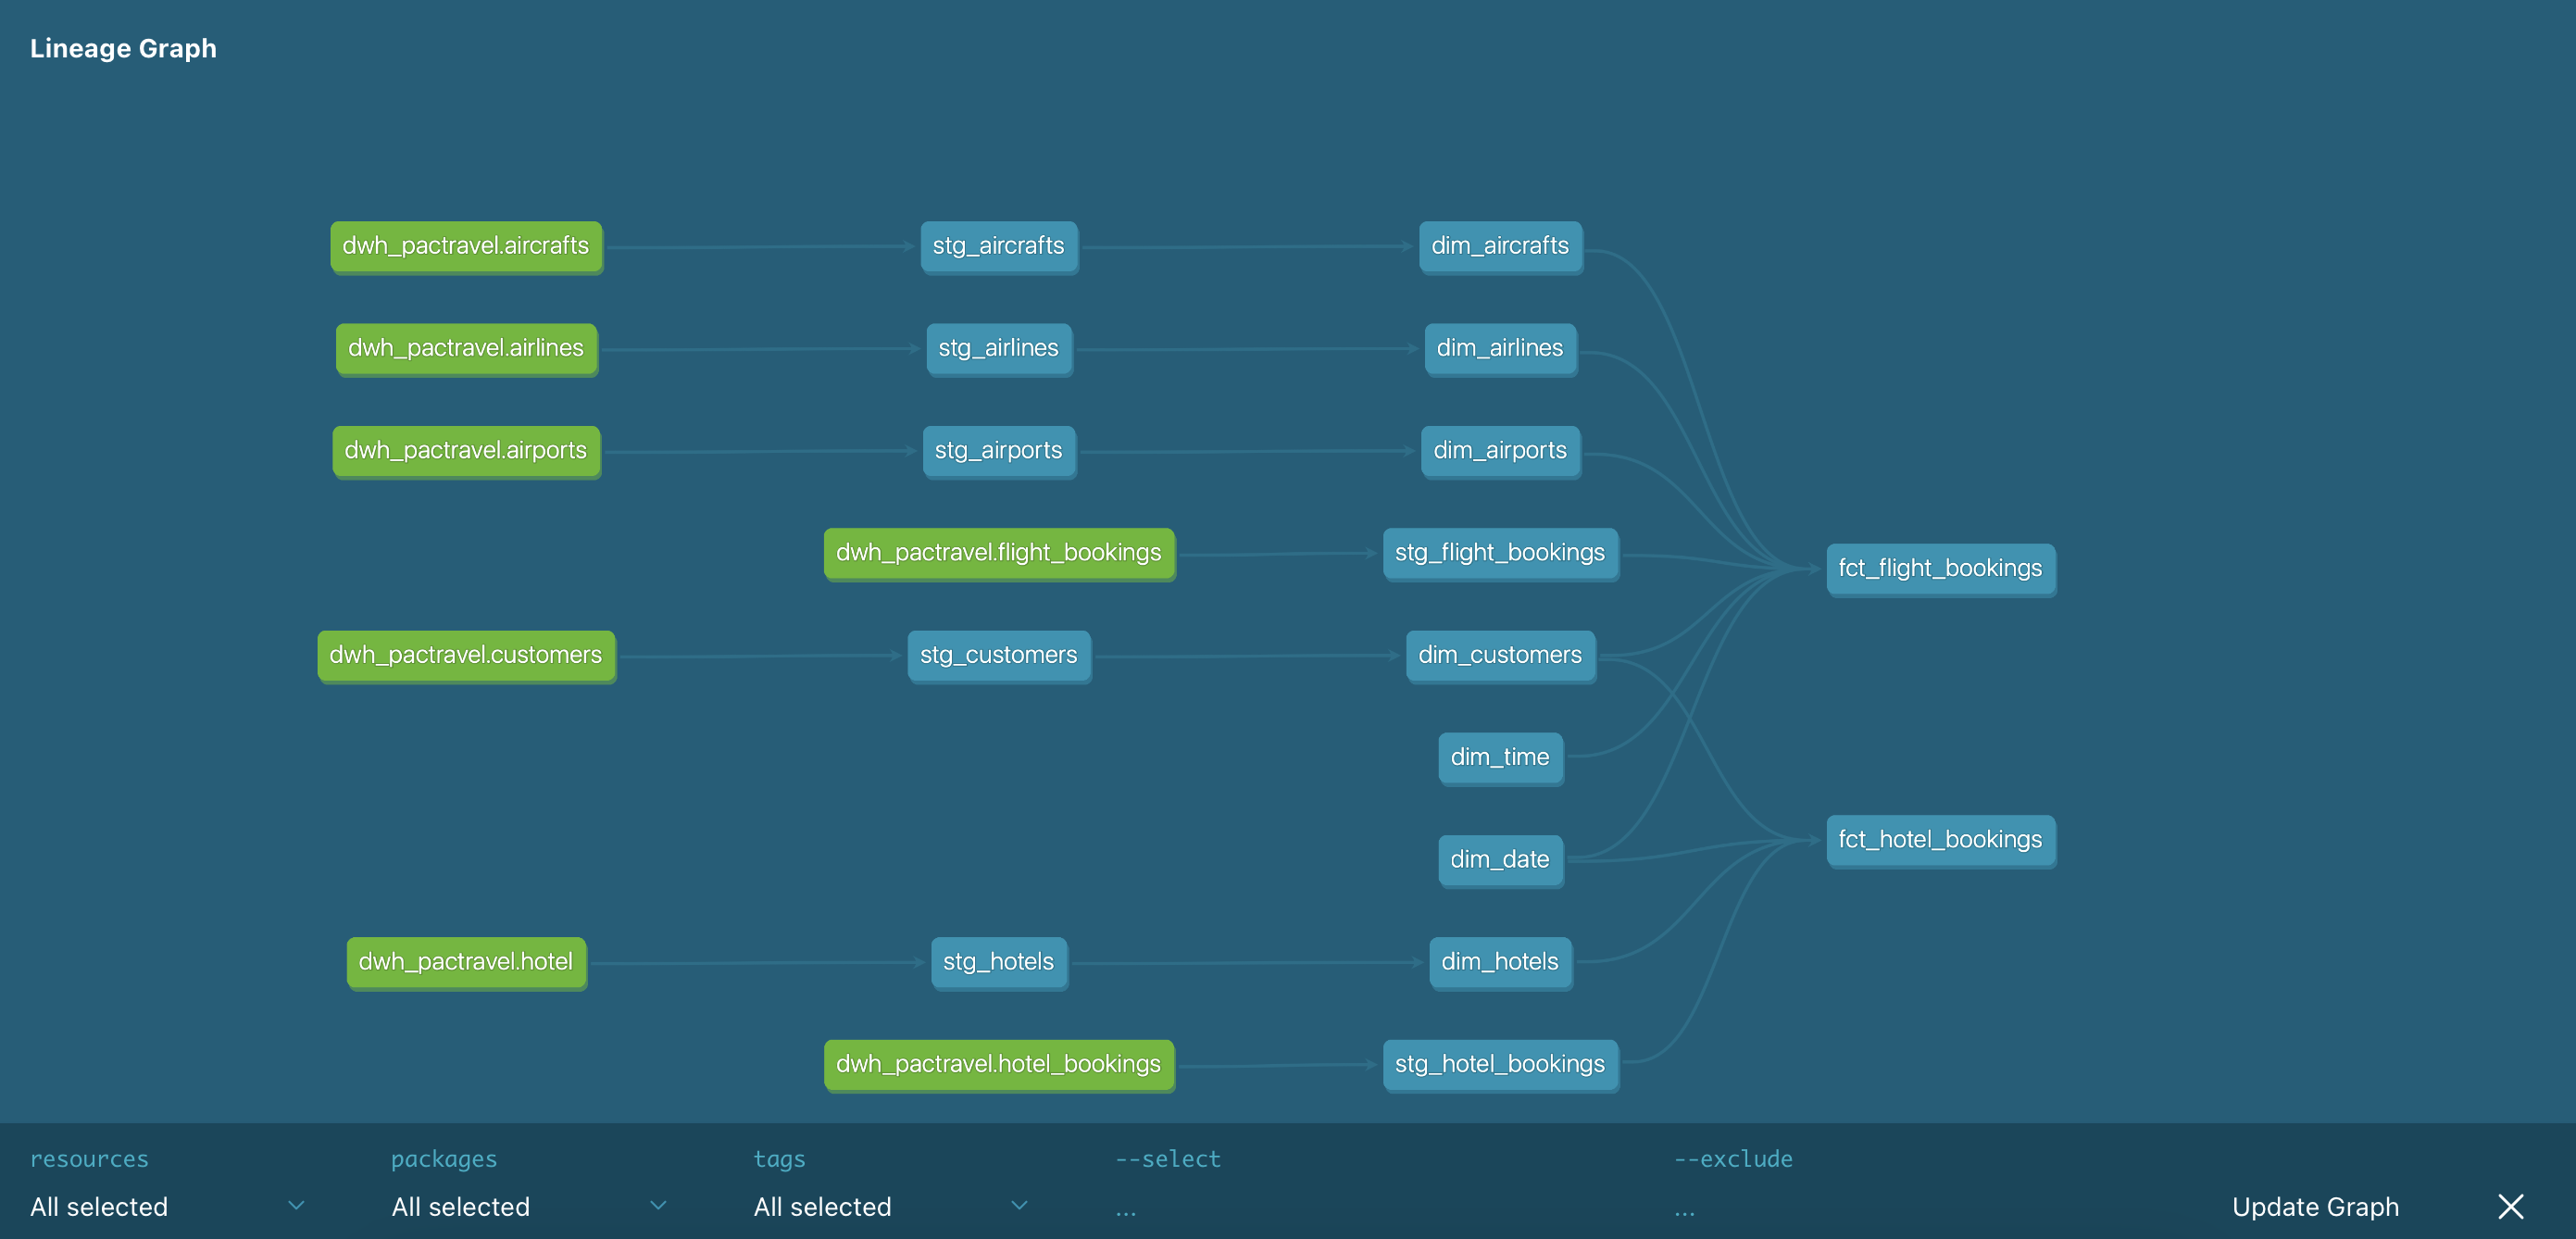
Source DB ──▶ Extract ──▶ Load ──▶ Staging ──▶ dbt ──▶ Marts │ │ │ Python Python SQL models (extract.py) (load.py) (staging → marts)Why dbt?
dbt handles the transformation layer with features raw SQL doesn’t have:
ref()function — Automatic dependency resolution- Incremental models — Process only new data
- Testing — Built-in data quality checks
- Documentation — Lineage graphs and column descriptions
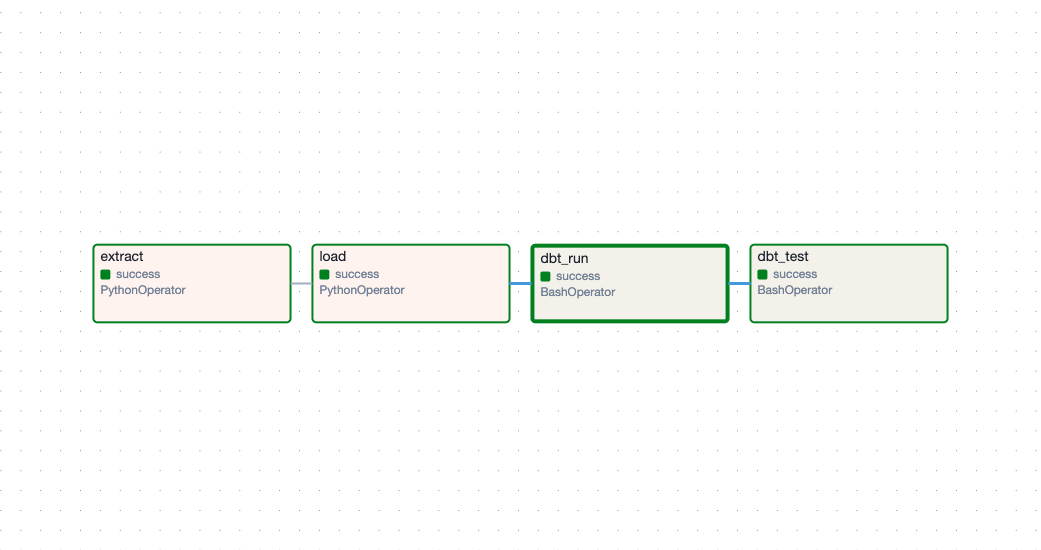
Orchestrating with Airflow
The pipeline has dependencies: you can’t transform before loading, can’t load before extracting. Something needs to manage this.
Airflow provides:
- DAG visualization — See the entire pipeline at a glance
- Retry logic — Automatic retries on transient failures
- Scheduling — Run daily, hourly, or on triggers
- Monitoring — Alerts when tasks fail
The DAG:
Handling Incremental Loads
For fact tables that grow daily, rebuilding everything is wasteful. Instead:
{{  config(    materialized='incremental',    unique_key='sk_flight_booking_id',    incremental_strategy='merge'  )}}
SELECT ...FROM {{ ref('stg_flight_bookings') }}
{% if is_incremental() %}WHERE departure_date >= (  SELECT MAX(departure_date) - INTERVAL '3 days'  FROM {{ this }}){% endif %}
Why 3-day lookback?
Late-arriving data is common — a booking made Friday might not appear in the source until Monday. Looking back 3 days catches these without reprocessing the entire history.
The Result
What the Warehouse Enables
Before: Get last week’s booking count
SELECT COUNT(*)FROM flight_bookings fbJOIN customers c ON fb.customer_id = c.customer_idJOIN airlines a ON fb.airline_id = a.airline_idWHERE fb.booking_date >= CURRENT_DATE - INTERVAL '7 days';-- Wait, is booking_date the right field? What timezone?After:
SELECT COUNT(*)FROM fct_flight_bookings fJOIN dim_date d ON f.date_id = d.date_idWHERE d.date_actual >= CURRENT_DATE - INTERVAL '7 days';Clear grain. Consistent date handling. No ambiguity.
Revenue by Airline, by Month
SELECT d.month_name, a.airline_name, SUM(f.price) as revenue, COUNT(*) as bookingsFROM fct_flight_bookings fJOIN dim_date d ON f.date_id = d.date_idJOIN dim_airlines a ON f.sk_airline_id = a.sk_airline_idGROUP BY d.month_name, a.airline_nameORDER BY revenue DESC;Two joins. Any analyst can write this.
Pipeline Stats
| Component | Count |
|---|---|
| Staging models | 7 |
| Mart models | 7 (5 dims + 2 facts) |
| dbt tests | 70+ |
| CI pipeline | GitHub Actions |
What I’d Improve
-
Add snapshot tables — Track dimension history with dbt snapshots for Type 2 SCD where needed
-
Partition fact tables — By month, for faster queries on recent data
-
Add data freshness checks — Alert if source data stops flowing
-
Build a semantic layer — Metrics definitions in dbt or a tool like Metabase